Table of Contents
Google Analytics 4 tutorial is an essential tool for anyone looking to measure website traffic, performance, and visitor behavior.
Recently, Google announced the Google Analytics 4 tutorial which has deeper integrations, analytics, cross-device analytics, and more to help you get a better understanding of your online performance.
This Google Analytics 4 tutorial for beginners will help you learn how to use, understand and navigate Google Analytics 4.
How to Use Google Analytics?
If you haven’t yet installed Google Analytics on your website, feel free to watch our easy-to-follow tutorials on how you can do so on WordPress or Shopify.
1. Login to Google Analytics
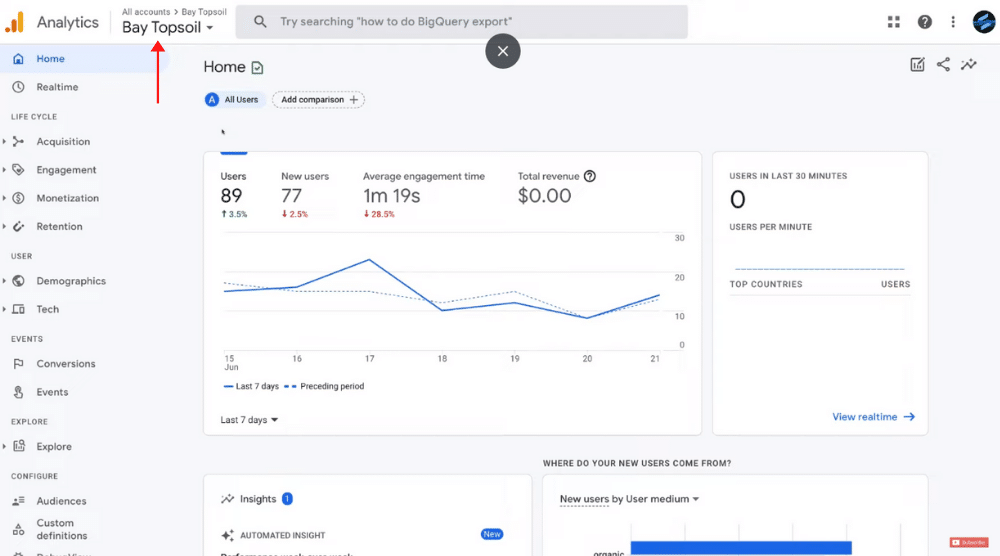
If you don’t see your current property selected in the top-left corner, then click on it, select your account, and then the property that’s associated with that account.
If your Google Analytics dashboard doesn’t look like the one in the screenshot, you’re probably using an older version.
Most likely you’re using Universal Analytics (that we’re using for a different account).
However, we recommend using Google Analytics 4 since it’s a newer version and supports the cross-platform approach.
This means you can measure more complex analytics across different apps and websites – more information usually means better decisions – and a better business!
Moreover, it has a more dynamic and user-friendly interface compared to Universal Analytics.
In this Google Analytics 4 tutorial, we’ll cover all the metrics to help you get the most out of it.
Read more: How to Connect Google Analytics 4 with Wix & Squarespace
2. Home Dashboard
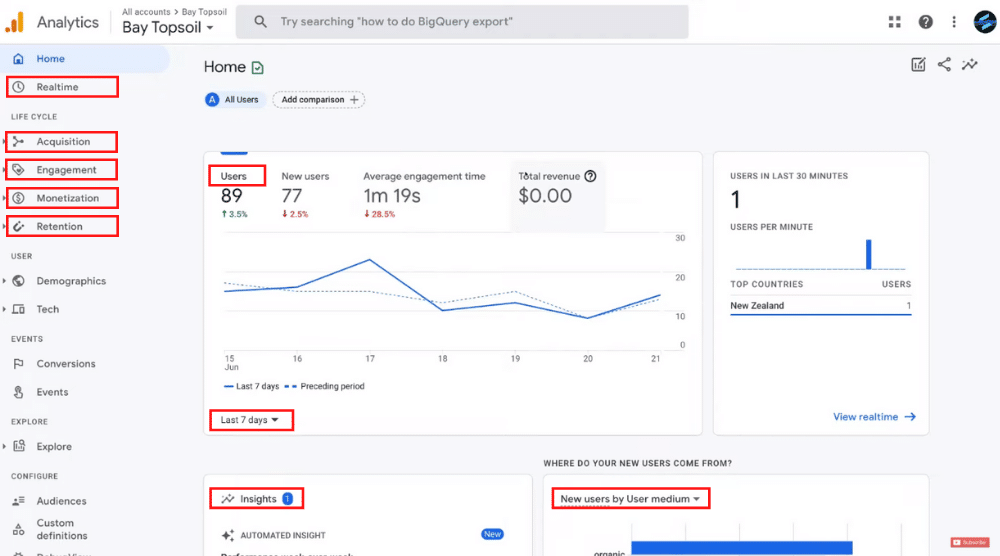
This is a snapshot of everything that’s happening on your website – namely, acquisition, engagement, monetization, and retention.
As a beginner, you’re going to spend the majority of your time on your Home dashboard.
Here, the first element you can see is the ‘Users’. Down below (the graph), you can see the number of users that visited your website over a period of time (7 days).
For each day, you can observe the number of visitors on your home dashboard. Apart from that, you can also change the time period from ‘7 days’ to ‘Last 28 days’ or Last 90 days’, for example.
Or you can set a custom time period on Google Analytics.
As you can see, over the last 7 days, we’ve had 89 users.
That’s a 3.5% increase from the last week. In the same duration, we’ve had 77 new users. The average engagement time of these visitors on our website is 1 minute 19 seconds, as you can see on the snapshot.
From the last 7 days, the engagement has dropped by 28.5%. Next to that, we have ‘Total revenue’.
This is important if you sell products on your website.
For this Google Analytics tutorial, we have used a service-based business so you won’t see any revenue figures for this website.
Next to this, we have ‘Realtime’. This is where you can view your website visitors in real-time. As you can see, in the last 30 minutes, we had 1 user from New Zealand.
If you click on ‘View real time’, it’s going to bring up more in-depth analytics in regards to real-time visitors.
Below the home overview, you’ll find ‘Insights’. Now, Google Analytics 4 is focusing on machine learning.
So, these are automated insights that you can look at to essentially measure your online performance.
You can also click on ‘View all insights’ to see all your insights.
Next to Insights, we have ‘New users by User medium’.
As you may observe, the majority of our visitors on this website are coming from organic traffic (people searching for specific keywords and finding your business).
Below that we have CPC (cost per click).
For this particular website, we’re using Google Ads (pay per click). Therefore, we’re driving both organic and paid traffic to this website.
Again, you can change the time duration if you like. We’re going to dive more into user acquisition shortly.
Now, if you scroll down, you can see your top campaigns. ‘Session Medium’ tells you where your visitors are coming from and landing on your website. You can also see the number of sessions per medium.
Think about ‘Sessions’ as multiple visits to your website.
The same user can visit your website multiple times during a specific period.
As you can see, we’ve had 62 sessions via the organic medium. Now, that does not mean 62 users. This could be 30 users who have visited your website at least twice.
Apart from that, you can view the geographic locations of your visitors on the right. Right now, we have ‘Country’ selected from the drop-down.
As it’s apparent, most website visitors are from New Zealand, followed by the United States.
Click on ‘View countries’ for more information or change the time period if you like.
Scroll down to see the user activity over time. Over the last 90 days (or 3 months), there has been a slight decline in traffic.
That means it could be because of the season or it could be due to other factors like your website or the nature of your business.
But this gives you an idea of how your website is performing over time.
To your right, you can see ‘User activity by cohort’. This is more advanced and we’re not going to cover it in this Google Analytics tutorial for beginners.
If you scroll further, you can see which pages and screens on your website get the most views.
Our home page is the most popular one according to the snapshot here. You can also see the number of views and percentage change for the most popular pages on your website.
Next to this, we have top events. An event can be anything that happens on your website or your app.
The event insights on Google Analytics 4 are more sophisticated compared to Universal Analytics.
As you may observe, the first event name is ‘page_view’. In the last 7 days, we’ve had 280 page views.
Other events include user_engagement, session_start, first_visit, scroll, and click.
Read more : How to Install Google Analytics on WordPress
3. Realtime
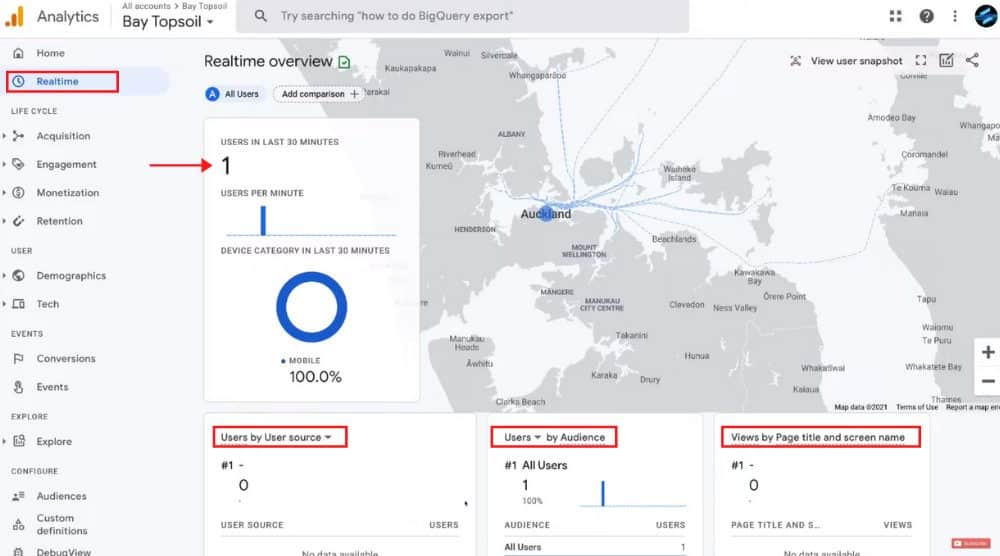
As you can see, we’ve got 1 visitor in the last 30 minutes coming from mobile.
You will also find:
- Users by User source.
- Users by Audience.
- Views by Page title and screen name – this shows where the users are currently at on your website.
However, we don’t currently have any visitors to our website right now.
Also read: How To Setup Google Search Console
4. Acquisition
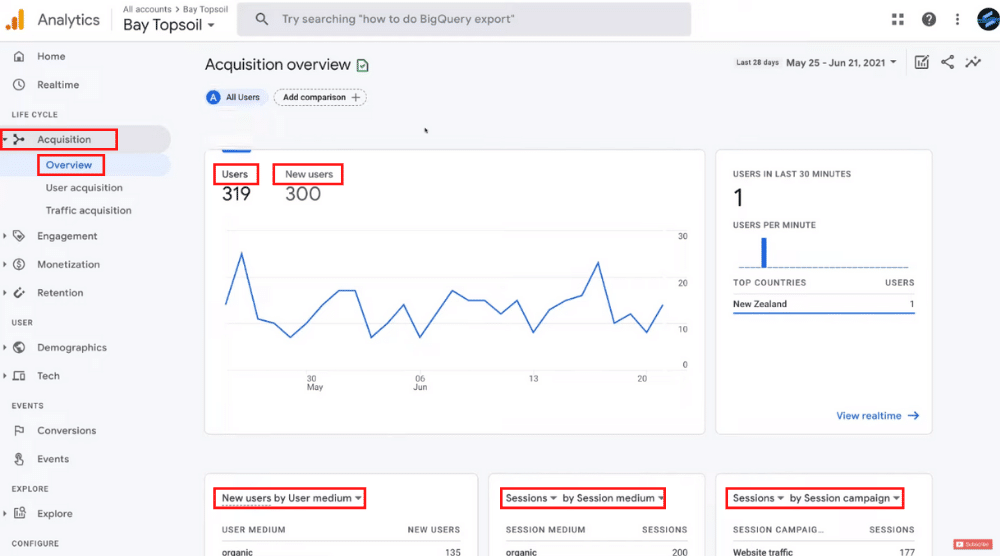
Select it and then click ‘Overview’. We’ve discussed many of these metrics at the beginning including users, new users, real-time, new users by user medium, and session medium.
Next to ‘Session medium’, you’ll find ‘Session campaign’.
This shows our current campaign. We’re driving paid traffic to this website. What you can do is connect Google Ads with your Google Analytics account. That’s going to import analytics from Google Ads to Google Analytics and vice versa.
Down below we have ‘Lifetime value’. Again, this is important if you sell products online.
If you want a more in-depth look at your user acquisition, you can simply select ‘User acquisition’ or ‘Traffic acquisition’ on your left.
However, for beginners, this ‘Acquisition overview’ is sufficient enough to gather the information you need when you’re monitoring your website.
Also read : Google Search Console Tutorial for Beginners
5. Engagement
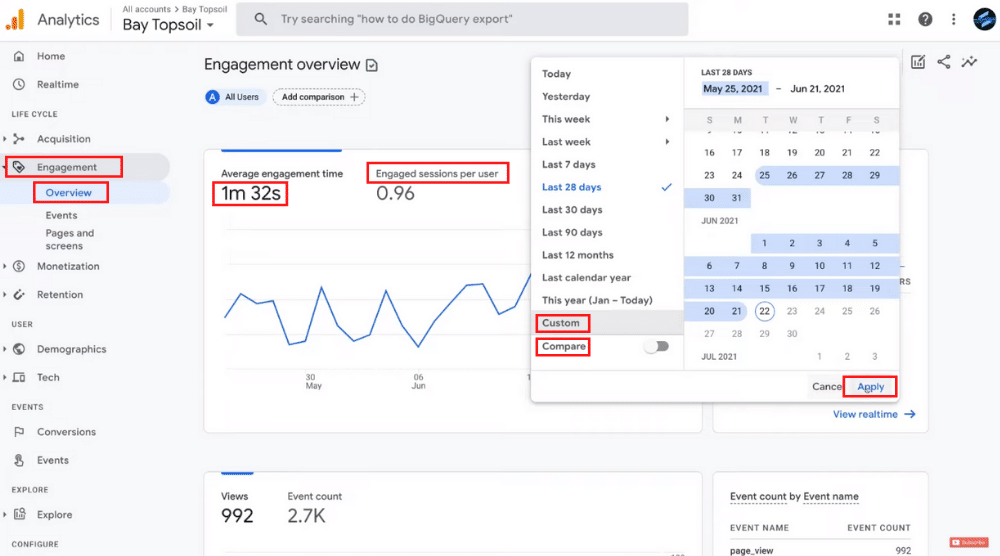
Select it and then click on ‘Overview’. This will show you the user engagement on your website or application.
For example, you can see the average engagement time here is 1 minute 32 seconds. That includes scrolling, clicking, or navigating through different pages and sections on our website.
We’ve also got:
- Engaged sessions per user.
- Average engagement time per session.
Again, we can navigate up and change the default periods or click ‘Custom’ to set a custom time period.
You can also compare the periods. For example, if we wanted to see the last 28 days and then we wanted to compare with 28 days one year ago, then we can come down and select ‘Compare’.
However, we’re going to leave it as ’28 days’ and click ‘Apply’. If you scroll down, you can see ‘Views’ and ‘Event count’.
On your right, you’ll notice ‘Event count by Event name’.
Again, you can see our top pages down below. By scrolling further, you’ll find ‘User stickiness’.
This is not important for those who are just getting started with Google Analytics.
For a more in-depth look, you can visit ‘Events’ or ‘Pages and screens’ on your left.
Also read : Google Ads Conversion Tracking Tutorial for Beginners
6. Monetization
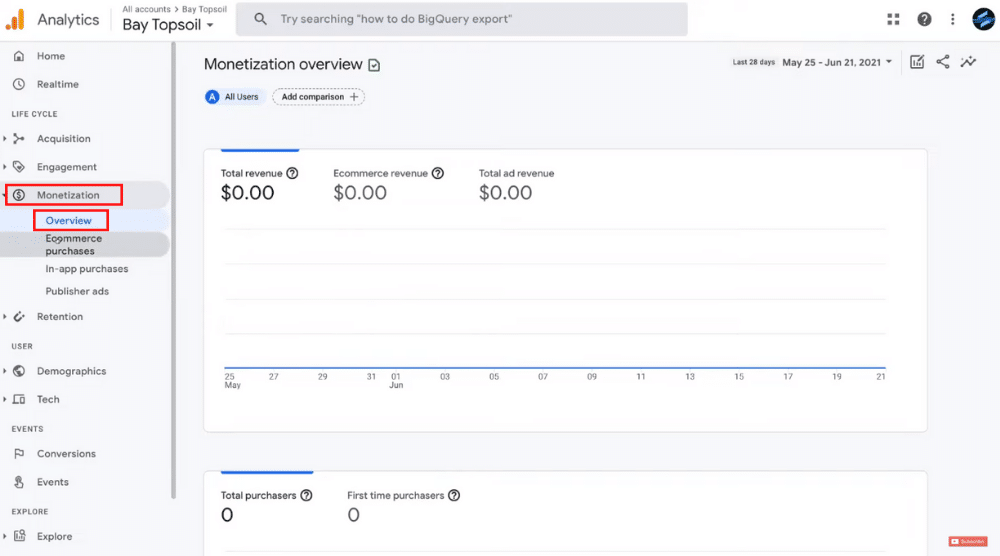
Again, monetization is not important for this service-based website. However, if you were selling products online or generating revenue from your website then, this is where you can see your total revenue, ecommerce revenue, and total ad revenue.
On your left, you can find more in-depth information in terms of ecommerce purchases, in-app purchases, and publisher ads.
Also read: How To Setup Google Ads Conversion Tracking for Wix
7. Retention
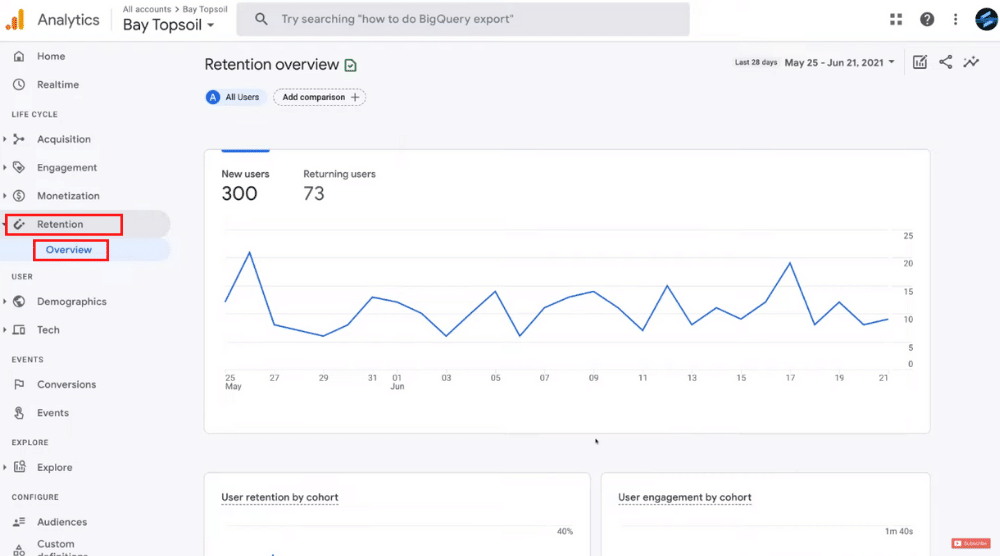
8. Demographics
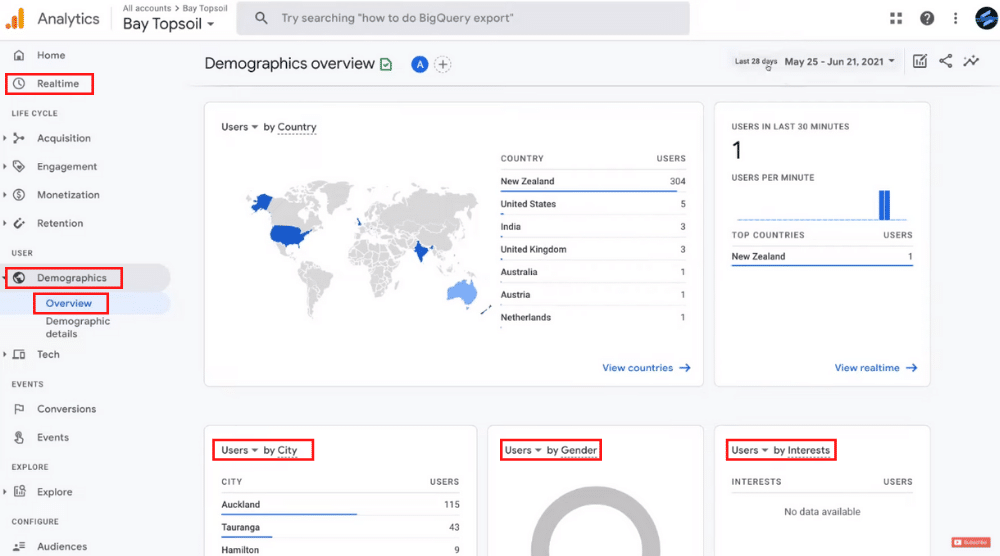
Here, we have a snapshot of users by country. Again, you can change the time period and compare month-on-month or year-on-year or you can create a custom time period.
Besides, you can view:
- Realtime users.
- Users by City – this could be important if you’re a local business. You can see that our top city is Auckland, followed by Tauranga, Hamilton, and Christchurch.
- Users by Gender.
- Users by Interests.
- Users by Age.
- Users by Language.
In this Google Analytics 4 tutorial, we’re not going to talk about gender and interest targeting.
9. Tech
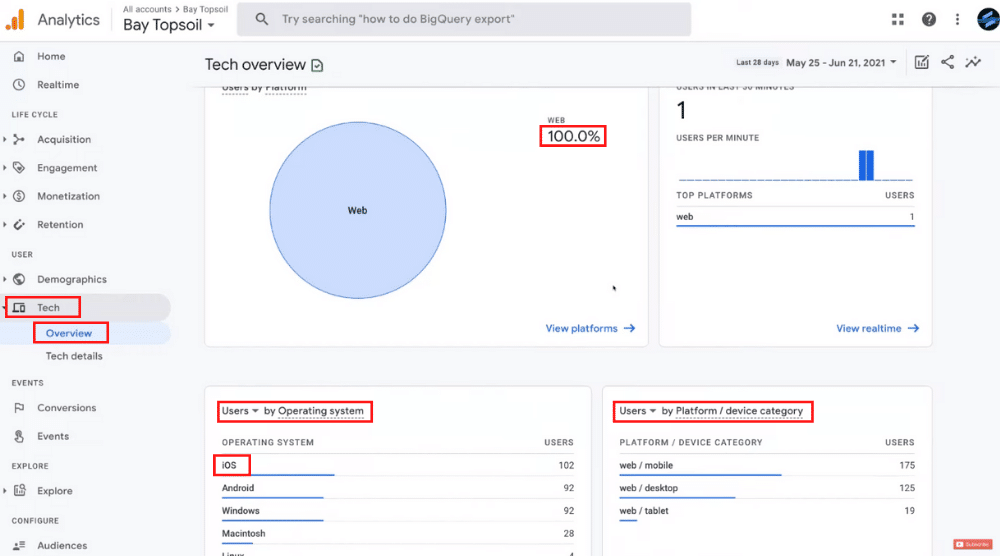
This is where you can see where your users are coming from based on the device and operating system. As you can see, we’ve got our 100% users coming from the internet (or the web).
Apart from that, the top operating system that the users are viewing our website from is iOS. Next to it, you can see ‘Users by Platform/device category’.
The majority of our visitors are coming from mobile, followed by desktop and tablet.
This would tell us that we need to make our website more mobile-responsive.
Below this, you can view ‘Users by Browser’ (Chrome, Safari, and Edge) and ‘Users by Device category’.
By scrolling further, you can see
- Users by Screen resolution.
- Users by App version.
- Latest app release overview.
- App stability overview.
- Users by Device model.
10. Conversions
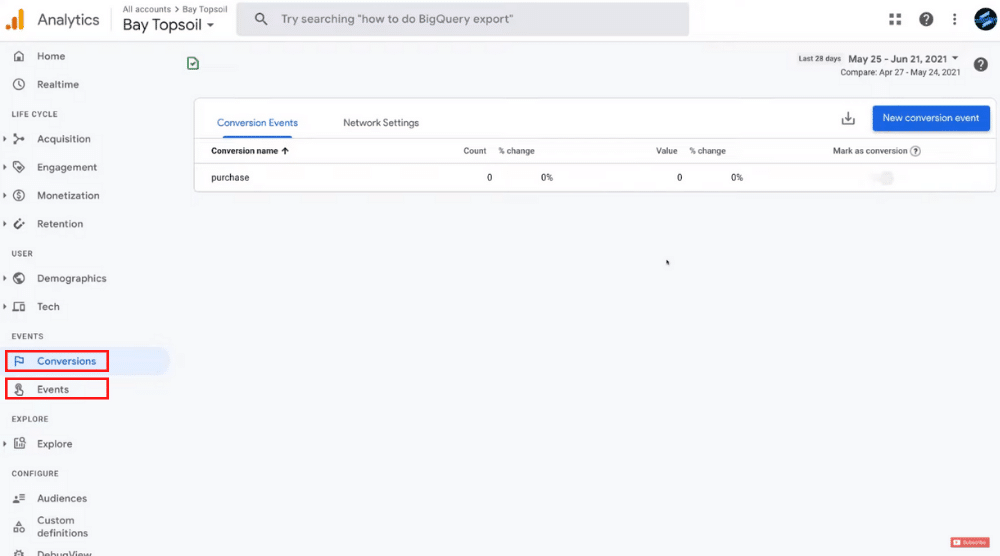
Here, you have important conversions that you can monitor. You can go ahead and create new conversion events.
However, in this Google Analytics tutorial for beginners, we’re not going to discuss too much about conversions. This is something for a more advanced tutorial in the near future.
11. Events
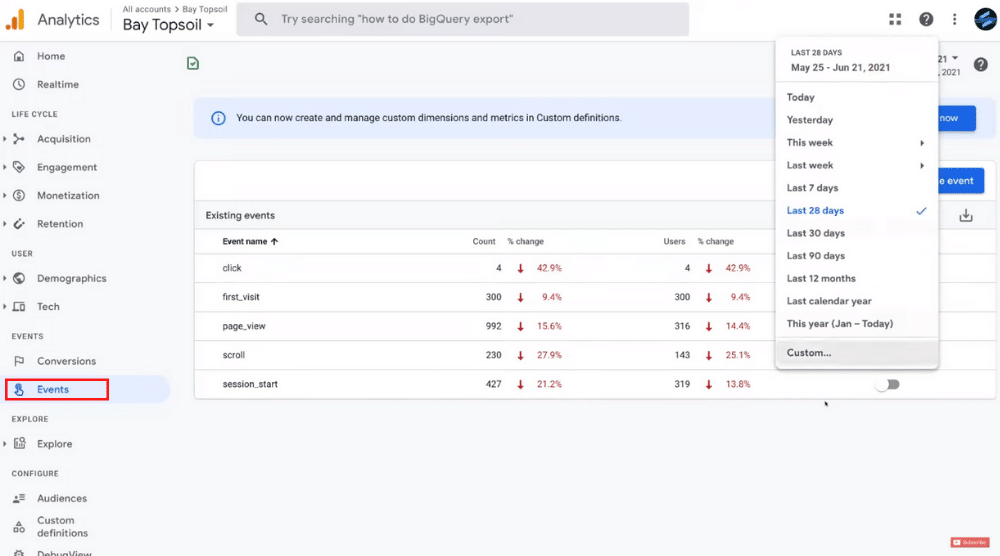
From the top-right, you can change the date range if needed. You can also modify any event or create a new one.
12. Explore
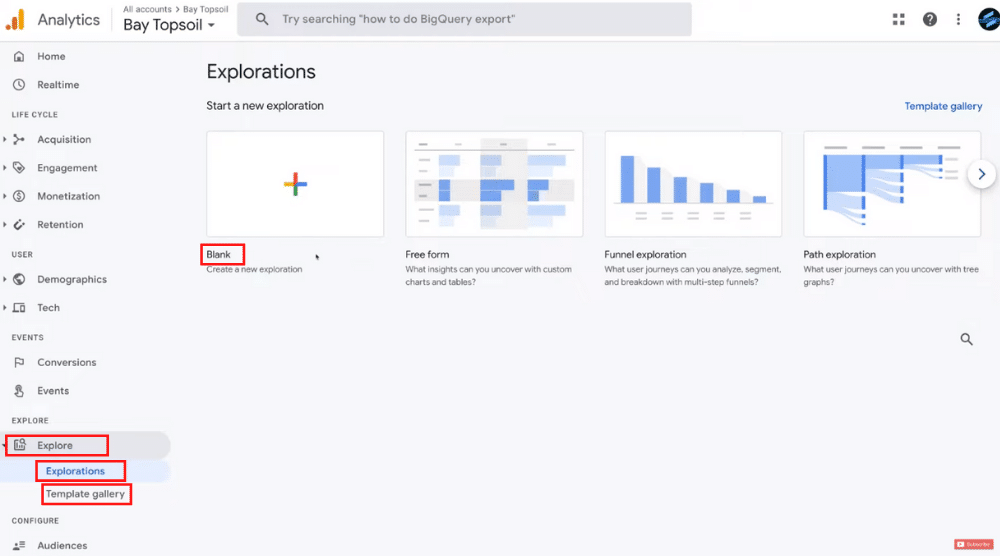
The great thing with Google Analytics 4 is that you can generate your own custom reports based on what’s important to you. For example, you can navigate up to ‘Blank’ or you can select a premade template.
You can also navigate to ‘Template gallery’ and select a reporting template that you want to use. We’re going to select ‘Blank’. On the left-hand side, we can simply drag each of these segments, dimensions, and metrics over to the space on the right-hand side to create a custom report.
For example, if we want to see paid traffic, we can drag and drop it to ‘Segment Comparisons’.
We can compare this with Direct traffic and Mobile traffic so we’ll drag those under Segment Comparisons as well.
Down below, under ‘Rows’, we can drag a Dimension (Country, for example).
As you can see, for each of these traffic sources, we have our top four countries selected. You can follow the same process for the ‘Device category’.
You can easily download your custom report in different reports.
13. Admin
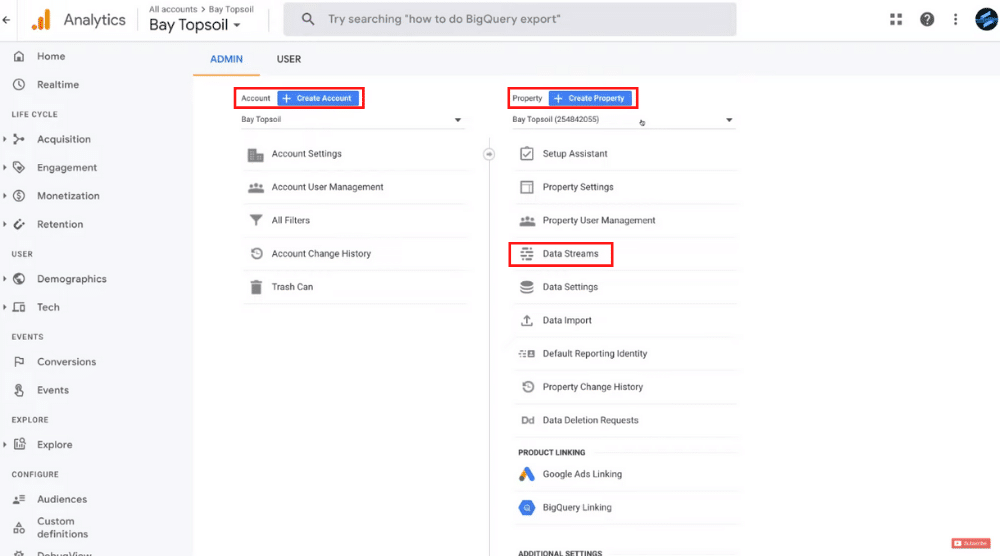
This is the last section that we want to cover in this Google Analytics tutorial. Up here we have ‘Account’ and ‘Property’ selected.
If you haven’t already installed Google Analytics on your website, what you would do is come down to ‘Data Streams’.
Select the data stream that you created. Depending on what content management system you’re using, take the measurement ID and then either take the Global site tag or Google Tag Manager.
And this is the information that you’ll use to connect Google Analytics with your website.
If we exit out of that and navigate over to ‘Property User Management’, you can connect other people (a web developer, for example) to your account to help you manage your Google Analytics and review your performance.
Google Analytics 4 Tutorial for Beginners (Video Guide)
That is everything we wanted to cover in this Google Analytics 4 tutorial. But if you are a beginner and want to understand each step through a visual walk through, then we have a video tutorial just for you.
Enjoy this complete beginners video guide to Google Analytics!
